
File:20210703 Variwide chart of greenhouse gas emissions per capita by country (includes OTHER).svg

此SVG文件的PNG预览的大小:800 × 450像素。 其他分辨率:320 × 180像素 | 640 × 360像素 | 1,024 × 576像素 | 1,280 × 720像素 | 2,560 × 1,440像素 | 1,600 × 900像素。
原始文件 (SVG文件,尺寸为1,600 × 900像素,文件大小:2 KB)
摘要
| 描述 |
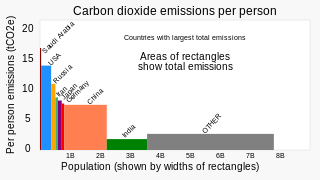
English: Chart showing per capita greenhouse gas emissions (or CO2 emissions, depending on the version), by country, for countries with the most total emissions, with the area of each column showing total emissions (includes column for "Other")
|
||
| 日期 | |||
| 来源 | 自己的作品 | ||
| 作者 | RCraig09 | ||
| 其他版本 |
|
.svg)

.svg?uselang=zh)
.svg?uselang=zh)
.svg?action=history&uselang=zh)
.svg)
.svg)
许可协议
我,本作品著作权人,特此采用以下许可协议发表本作品:
本文件采用知识共享署名-相同方式共享 4.0 国际许可协议授权。
- 您可以自由地:
- 共享 – 复制、发行并传播本作品
- 修改 – 改编作品
- 惟须遵守下列条件:
- 署名 – 您必须对作品进行署名,提供授权条款的链接,并说明是否对原始内容进行了更改。您可以用任何合理的方式来署名,但不得以任何方式表明许可人认可您或您的使用。
- 相同方式共享 – 如果您再混合、转换或者基于本作品进行创作,您必须以与原先许可协议相同或相兼容的许可协议分发您贡献的作品。
文件历史
点击某个日期/时间查看对应时刻的文件。
| 日期/时间 | 缩略图 | 大小 | 用户 | 备注 | |
|---|---|---|---|---|---|
| 当前 | 2023年10月16日 (一) 19:00 | | 1,600 × 900(2 KB) | RCraig09 | Version 4: explain horizontal axis (populations are shown by widths of rectangles) |
| 2023年8月16日 (三) 06:10 |  | 1,600 × 900(2 KB) | RCraig09 | Version 3: removing "tspan" element from vertical axis label to work around ongoing SVG text rendering problems on Wikimedia | |
| 2022年1月1日 (六) 03:31 |  | 1,600 × 900(2 KB) | RCraig09 | Version 2: update to include data for 2020 . . . . This version focuses on CO2 only (not on all greenhouse gases) . . . a more-current dataset of all greenhouse gases may be a better replacement . . . . See File:20210626 Variwide chart of greenhouse gas emissions per capita by country.svg for a 15-country CO2 chart with 2020 | |
| 2021年7月6日 (二) 16:05 |  | 1,600 × 900(2 KB) | RCraig09 | Uploaded own work with UploadWizard |
文件用途
全域文件用途
以下其他wiki使用此文件:
- en-two.iwiki.icu上的用途
- Greenhouse gas emissions
- Energy in Iran
- Greenhouse gas emissions by the United States
- Climate justice
- Climate policy of China
- Climate change in Japan
- Climate change in the United States
- Climate change in China
- Talk:Climate change denial/Archive 33
- Climate change in India
- Greenhouse gas emissions by China
- Greenhouse gas emissions by Russia
- 2021 in the environment
- Wikipedia:Graphics Lab/Illustration workshop/Archive/Jun 2021
- Talk:Climate change in the United States/Archive 1
- User:Alexsachini/sandbox
- ja-two.iwiki.icu上的用途
- mk.wikipedia.org上的用途
- pt.wikipedia.org上的用途
.svg)