
File:Correlation examples2.svg

此SVG文件的PNG预览的大小:506 × 231像素。 其他分辨率:320 × 146像素 | 640 × 292像素 | 1,024 × 467像素 | 1,280 × 584像素 | 2,560 × 1,169像素。
原始文件 (SVG文件,尺寸为506 × 231像素,文件大小:2.18 MB)
摘要
| 描述 |
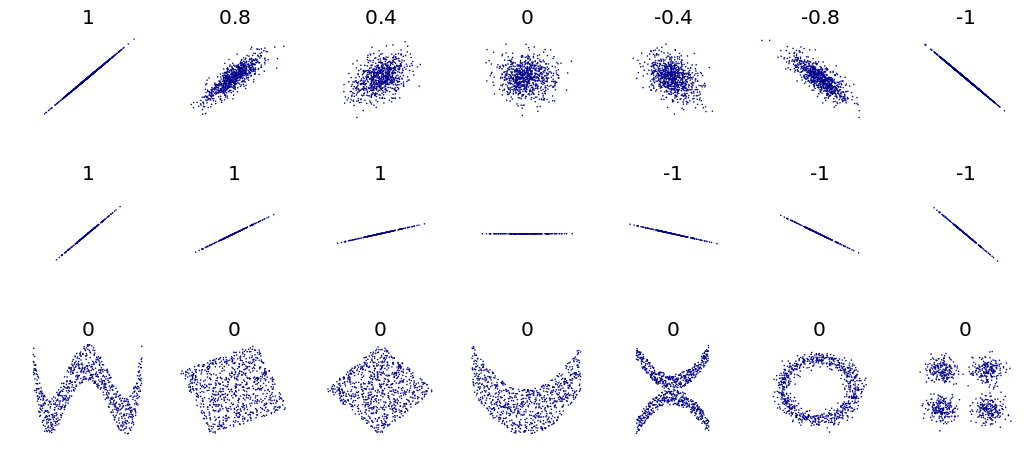
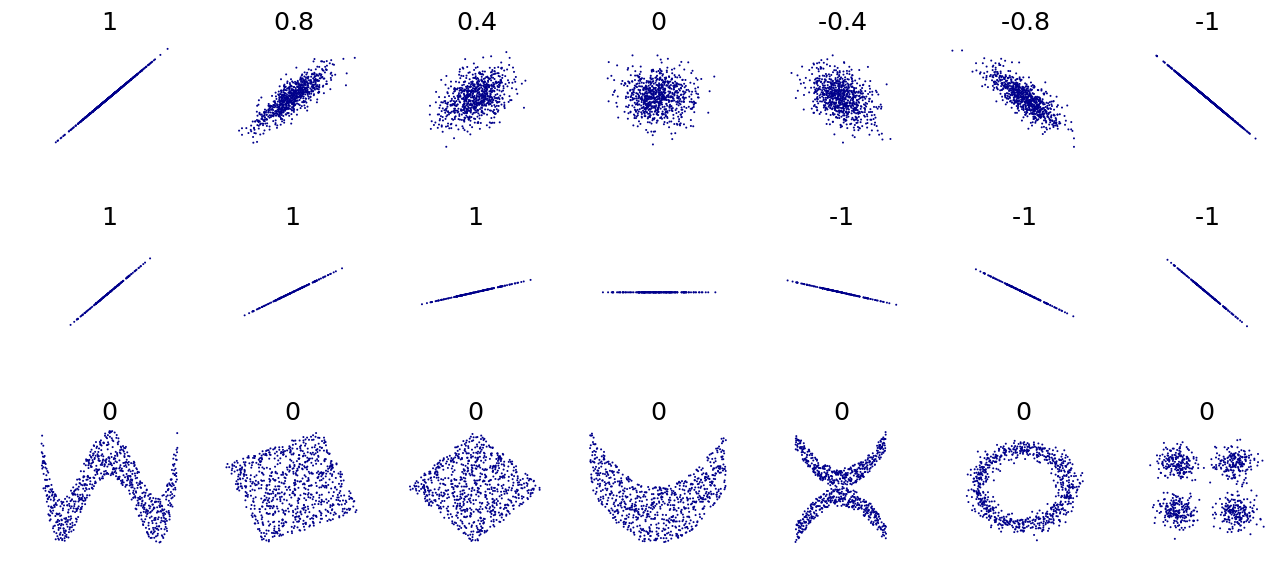
English: redesign File:Correlation_examples.png using vector graphics (SVG file) |
| 日期 | |
| 来源 | 自己的作品, original uploader was Imagecreator |
| 作者 | DenisBoigelot, original uploader was Imagecreator |
| 授权 (二次使用本文件) |
Released into the public domain (by the authors). |
| 其他版本 |
此文件衍生的作品: CovrarianceCorrelation.svg File:Correlation_examples.png |
#Title: An example of the correlation of x and y for various distributions of (x,y) pairs
#Tags: Mathematics; Statistics; Correlation
#Author: Denis Boigelot
#Packets needed : mvtnorm (rmvnorm), RSVGTipsDevice (devSVGTips)
#How to use: output()
#
#This is an translated version in R of an Matematica 6 code by Imagecreator.

library(mvtnorm)
library(RSVGTipsDevice)

MyPlot <- function(xy, xlim = c(-4, 4), ylim = c(-4, 4), eps = 1e-15) {
   title = round(cor(xy[,1], xy[,2]), 1)
   if (sd(xy[,2]) < eps) title = "" # corr. coeff. is undefined
   plot(xy, main = title, xlab = "", ylab = "",
        col = "darkblue", pch = 16, cex = 0.2,
        xaxt = "n", yaxt = "n", bty = "n",
        xlim = xlim, ylim = ylim)
}

MvNormal <- function(n = 1000, cor = 0.8) {
   for (i in cor) {
      sd = matrix(c(1, i, i, 1), ncol = 2)
      x = rmvnorm(n, c(0, 0), sd)
      MyPlot(x)
   }
}

rotation <- function(t, X) return(X %*% matrix(c(cos(t), sin(t), -sin(t), cos(t)), ncol = 2))

RotNormal <- function(n = 1000, t = pi/2) {
   sd = matrix(c(1, 1, 1, 1), ncol = 2)
   x = rmvnorm(n, c(0, 0), sd)
   for (i in t)
      MyPlot(rotation(i, x))
}

Others <- function(n = 1000) {
   x = runif(n, -1, 1)
   y = 4 * (x^2 - 1/2)^2 + runif(n, -1, 1)/3
   MyPlot(cbind(x,y), xlim = c(-1, 1), ylim = c(-1/3, 1+1/3))

   y = runif(n, -1, 1)
   xy = rotation(-pi/8, cbind(x,y))
   lim = sqrt(2+sqrt(2)) / sqrt(2)
   MyPlot(xy, xlim = c(-lim, lim), ylim = c(-lim, lim))

   xy = rotation(-pi/8, xy)
   MyPlot(xy, xlim = c(-sqrt(2), sqrt(2)), ylim = c(-sqrt(2), sqrt(2)))

   y = 2*x^2 + runif(n, -1, 1)
   MyPlot(cbind(x,y), xlim = c(-1, 1), ylim = c(-1, 3))

   y = (x^2 + runif(n, 0, 1/2)) * sample(seq(-1, 1, 2), n, replace = TRUE)
   MyPlot(cbind(x,y), xlim = c(-1.5, 1.5), ylim = c(-1.5, 1.5))

   y = cos(x*pi) + rnorm(n, 0, 1/8)
   x = sin(x*pi) + rnorm(n, 0, 1/8)
   MyPlot(cbind(x,y), xlim = c(-1.5, 1.5), ylim = c(-1.5, 1.5))

   xy1 = rmvnorm(n/4, c( 3,  3))
   xy2 = rmvnorm(n/4, c(-3,  3))
   xy3 = rmvnorm(n/4, c(-3, -3))
   xy4 = rmvnorm(n/4, c( 3, -3))
   MyPlot(rbind(xy1, xy2, xy3, xy4), xlim = c(-3-4, 3+4), ylim = c(-3-4, 3+4))
}

output <- function() {
   devSVGTips(width = 7, height = 3.2) # remove first and last line for no svg exporting
   par(mfrow = c(3, 7), oma = c(0,0,0,0), mar=c(2,2,2,0))
   MvNormal(800, c(1.0, 0.8, 0.4, 0.0, -0.4, -0.8, -1.0));
   RotNormal(200, c(0, pi/12, pi/6, pi/4, pi/2-pi/6, pi/2-pi/12, pi/2));
   Others(800)
   dev.off() # remove first and last line for no svg exporting
}
许可协议
我,本作品著作权人,特此采用以下许可协议发表本作品:
| 本作品采用知识共享CC0 1.0 通用公有领域贡献许可协议授权。 | |
| 采用本宣告发表本作品的人,已在法律允许的范围内,通过在全世界放弃其对本作品拥有的著作权法规定的所有权利(包括所有相关权利),将本作品贡献至公有领域。您可以复制、修改、传播和表演本作品,将其用于商业目的,无需要求授权。
|
文件历史
点击某个日期/时间查看对应时刻的文件。
| 日期/时间 | 缩略图 | 大小 | 用户 | 备注 | |
|---|---|---|---|---|---|
| 当前 | 2011年5月10日 (二) 06:00 | | 506 × 231(2.18 MB) | DenisBoigelot | {{Information |Description ={{en|1=fd}} |Source ={{own}} |Author =DenisBoigelot |Date = |Permission = |other_versions = }} fjdk |
文件用途
全域文件用途
以下其他wiki使用此文件:
- ast.wikipedia.org上的用途
- as.wikipedia.org上的用途
- be.wikipedia.org上的用途
- bn.wikipedia.org上的用途
- bs.wikipedia.org上的用途
- ca.wikipedia.org上的用途
- cs.wikipedia.org上的用途
- el.wikipedia.org上的用途
- en-two.iwiki.icu上的用途
- en.wikiversity.org上的用途
- en.wiktionary.org上的用途
- es.wikipedia.org上的用途
- fa.wikipedia.org上的用途
- fi.wikipedia.org上的用途
- fi.wiktionary.org上的用途
- fr.wikipedia.org上的用途
- ga.wikipedia.org上的用途
- ja-two.iwiki.icu上的用途
- jv.wikipedia.org上的用途
- ko.wikipedia.org上的用途
- pt.wikipedia.org上的用途
- ru.wikipedia.org上的用途
- sl.wikipedia.org上的用途
- sr.wikipedia.org上的用途
- sv.wikipedia.org上的用途
- tl.wikipedia.org上的用途
- uk.wikipedia.org上的用途
- www.wikidata.org上的用途
- zh-yue.wikipedia.org上的用途