
File:E12 values graph.svg

此SVG文件的PNG预览的大小:575 × 420像素。 其他分辨率:320 × 234像素 | 640 × 467像素 | 1,024 × 748像素 | 1,280 × 935像素 | 2,560 × 1,870像素。
原始文件 (SVG文件,尺寸为575 × 420像素,文件大小:4 KB)
摘要
| 描述 |
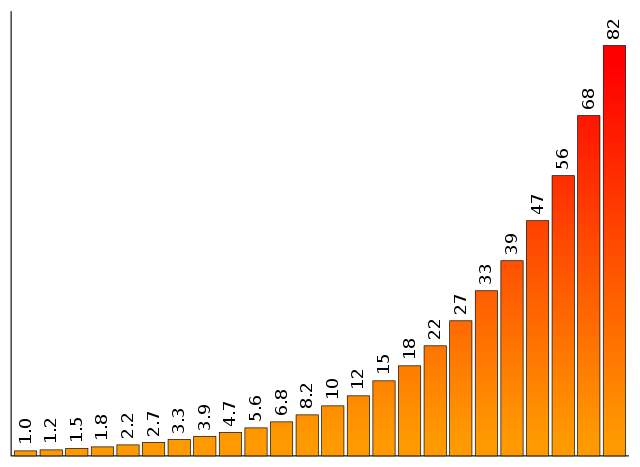
English: Graph showing values of the E12 series, which is used to standardize values of resistors and capacitors. The values shown cover two decades of the series, from 1 to 82, and illustrate the exponential nature of the series. |
| 日期 | |
| 来源 | Own work by uploader, designed to replace original bitmap image Image:E12_values_graph.png |
| 作者 | Qef |
| 其他版本 | Bitmap version showing the same data, but with superfluous labels, making it not language neutral: Image:E12_values_graph.png |
许可协议
| 本作品已被作者Qef释出到公有领域。这适用于全世界。 在一些国家这可能不合法;如果是这样的话,那么: |
Source code
This graph was generated by the Perl program below, which was specially written for the purpose. If changes need to be made, it's probably best to tweak the program and re-run it to get a new version, rather than editing the SVG directly.
use warnings;
use strict;

# The E12 series twice over, the first time divided by 10.
my @VALUES = qw(
    1.0 1.2 1.5 1.8 2.2 2.7 3.3 3.9 4.7 5.6 6.8 8.2
    10  12  15  18  22  27  33  39  47  56  68  82
);

# Parameters to set appearance.
my $AXIS_HT = 400;
my $VERT_SCALE = 4.5;
my $BAR_WIDTH = 20;
my $BAR_GAP = 3;
my $MARGIN = 10;

my $img_wd = ($BAR_WIDTH + $BAR_GAP) * @VALUES + $BAR_GAP + 2 * $MARGIN;
my $img_ht = $AXIS_HT + 2 * $MARGIN;
my $margin_right = $img_wd - $MARGIN;
my $margin_bottom = $img_ht - $MARGIN;

my $x = $MARGIN;
my $graph_path = '';
my $text_cmds = '';
for (@VALUES) {
    $x += $BAR_GAP;
    my $bar_ht = $_ * $VERT_SCALE;
    $graph_path .= "M$x,$margin_bottom v-$bar_ht h$BAR_WIDTH v$bar_ht Z\n";
    $x += $BAR_WIDTH;
    my $bar_top = $img_ht - $bar_ht - $MARGIN + -5;
    my $txt_x = $x - 0.5 * $BAR_WIDTH + 4.5;
    $text_cmds .= "  <text transform='translate($txt_x,$bar_top) rotate(270)'" .
                  " x='0' y='0' fill='#000' text-anchor='start'>$_</text>\n";
}

print <<"END";
<?xml version="1.0" encoding="UTF-8"?>
<svg version="1.0" width="$img_wd" height="$img_ht"
     xmlns="http://www.w3.org/2000/svg">

 <defs>
  <linearGradient id="grad" x2="0%" y1="0%" y2="100%">
   <stop offset="5%" stop-color="#F00" />
   <stop offset="95%" stop-color="#F90" />
  </linearGradient>
 </defs>

 <path stroke="#000" stroke-width="1" fill="none"
       d="M$MARGIN,$MARGIN V$margin_bottom H$margin_right"/>
 <path stroke="#000" stroke-width="0.6" fill="url(#grad)" d="$graph_path"/>
 <path stroke="#333" stroke-width="0.6" fill="url(#grad)" d="$graph_path">
 </g>
</svg>
END
文件历史
点击某个日期/时间查看对应时刻的文件。
| 日期/时间 | 缩略图 | 大小 | 用户 | 备注 | |
|---|---|---|---|---|---|
| 当前 | 2008年7月3日 (四) 17:07 | | 575 × 420(4 KB) | Qef | {{Information |Description={{en|1=Graph showing values of the E12 series, which is used to standardize values of resistors and capacitors. The values shown cover two decades of the series, from 1 to 82, and illustrates the exponential nature of the serie |
文件用途
以下页面使用本文件:
全域文件用途
以下其他wiki使用此文件:
- bg.wikipedia.org上的用途
- da.wikipedia.org上的用途
- de.wikipedia.org上的用途
- en-two.iwiki.icu上的用途
- User:Augur
- User:VinceyB
- User:Simen 88
- User:NekrosKoma
- User:Masterhomer
- Wikipedia:Userboxes/Philosophy
- User:MaesterTonberry
- User:Java7837/userboxing/Singularitarian
- User:Saukkomies/My userboxes
- User:Vaerinn
- User:Keskival
- User:Test35965
- User:Elsa-and-Anya
- User:ImmortalRationalist
- User:KiefKief
- User:AnnonJung
- User:Thablaqkgoat
- User:FrederickII
- E series of preferred numbers
- User:AllanVolt
- User:Just an ordinary human
- User:HeyTomek
- User:Berkay123456789
- en.wikiversity.org上的用途
- eo.wikipedia.org上的用途
- et.wikipedia.org上的用途
- he.wikipedia.org上的用途
- uk.wikipedia.org上的用途