
File:Empirical CDF.png
此为最大尺寸。
Empirical_CDF.png (400 × 320像素,文件大小:6 KB,MIME类型:image/png)
摘要
| 描述 |
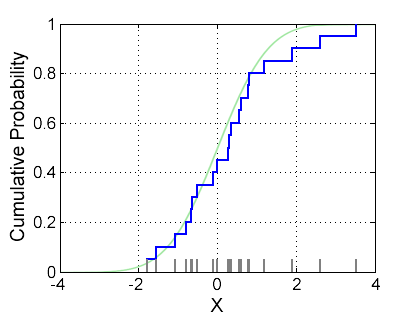
English: This is a visualization of an empirical distribution function. The grey bars show the samples corresponding to the ECDF and the green line is the theoretical distribution from which the samples have been drawn. |
| 日期 | |
| 来源 | 自己的作品 |
| 作者 | Bscan |
| 其他版本 |
|

%This is Matlab code to generate a visualization of the empirical
%distribution function
%This code released under the CC0 "license"

%Generate random samples
NumSamps =20;

%Get standard normally distributed samples
samples = randn(NumSamps,1);

%Get emprical cdf
[f,x] = ecdf(samples);

%Get real cdf
x_cdf = [-5:0.01:5];
y_cdf = normcdf(x_cdf);

%Generate figure;
figure; hold on;
plot(x_cdf,y_cdf,'-','Color',[0.6 0.6 0.6],'LineWidth',2);
stairs(x,f,'b-','LineWidth',2);
%The 1/NumSamps ensures the black bars are scaled to be probabilities
plot([samples samples]',[zeros(NumSamps,1) (1/NumSamps)*ones(NumSamps,1)]','-k','LineWidth',2);
set(gca,'FontSize',12)
grid on; box on;
xlim([-4 4])
许可协议
我,本作品著作权人,特此采用以下许可协议发表本作品:
| 本作品采用知识共享CC0 1.0 通用公有领域贡献许可协议授权。 | |
| 采用本宣告发表本作品的人,已在法律允许的范围内,通过在全世界放弃其对本作品拥有的著作权法规定的所有权利(包括所有相关权利),将本作品贡献至公有领域。您可以复制、修改、传播和表演本作品,将其用于商业目的,无需要求授权。
|
文件历史
点击某个日期/时间查看对应时刻的文件。
| 日期/时间 | 缩略图 | 大小 | 用户 | 备注 | |
|---|---|---|---|---|---|
| 当前 | 2018年1月28日 (日) 10:57 | | 400 × 320(6 KB) | Nagualdesign | Tweaks. |
| 2018年1月27日 (六) 22:05 |  | 412 × 318(6 KB) | Nagualdesign | Green curve. | |
| 2018年1月27日 (六) 20:11 |  | 412 × 318(6 KB) | Nagualdesign | Tail (top). | |
| 2018年1月27日 (六) 19:30 |  | 412 × 318(6 KB) | Nagualdesign | Antialiased numbers. | |
| 2018年1月27日 (六) 18:56 |  | 412 × 318(6 KB) | Nagualdesign | Antialiasing. | |
| 2013年3月25日 (一) 15:04 |  | 412 × 318(4 KB) | Bscan | User created page with UploadWizard |
文件用途
以下页面使用本文件:
全域文件用途
以下其他wiki使用此文件:
- en-two.iwiki.icu上的用途
- eu.wikipedia.org上的用途
- it.wikipedia.org上的用途