| 源代码 InfoField |
Python code
| Python source code
|
from numpy import *
from scipy import *
from scipy.integrate import odeint
from matplotlib.pyplot import *
from mpl_toolkits.axes_grid.axislines import SubplotZero

def myFun(u,t=0.,mu=.5):
    x = u[0]
    v = u[1]
    dx = v
    dv = -sin(x)
    return (dx,dv)

if __name__ == "__main__":
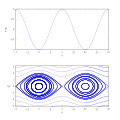
    fig = figure(figsize=(5.5,7))
    ax = SubplotZero(fig,211)
    x = linspace(-3*pi,3*pi,100)
    ax.plot(x,-cos(x),'b',lw=1.5)
    fig.add_subplot(ax)
    ax.grid(True,which='major')
    ax.minorticks_on()
    ax.axis('tight')
    ax.axis([-3*pi,3*pi, -1,1])
    ax.set_xticks(arange(-3*pi,3.1*pi,pi))
    ax.set_xticklabels(
        [r'$-3\pi$',r'$-2\pi$',
        r'$-\pi$',r'$0$',r'$\pi$',
        r'$2\pi$',r'$3\pi$'])
    ax.set_xlabel(r'$\theta$')
    ax.set_ylabel(r'$V(\theta)$')
    ax = SubplotZero(fig,212)
    fig.add_subplot(ax)
    t = linspace(0,50,200)
    for m in range(0,60,5):
        u = odeint(myFun,[m/10.,0.],t)
        ax.plot(u[:,0],u[:,1],'b',lw=1.5)
        ax.plot(-u[:,0],u[:,1],'b',lw=1.5)
        u = odeint(myFun,[0,m/10.],t)
        ax.plot(ma.masked_outside(u[:,0],-3*pi,3*pi),
            ma.masked_outside(u[:,1],-3,3),'b',lw=1.5)
        ax.plot(ma.masked_outside(-u[:,0],-3*pi,3*pi),
            ma.masked_outside(u[:,1],-3,3),'b',lw=1.5)
        ax.plot(ma.masked_outside(u[:,0],-3*pi,3*pi),
            ma.masked_outside(-u[:,1],-3,3),'b',lw=1.5)
        ax.plot(ma.masked_outside(-u[:,0],-3*pi,3*pi),
            ma.masked_outside(-u[:,1],-3,3),'b',lw=1.5)
    x = linspace(-3*pi,3*pi,20)
    y = linspace(-3,3,15)
    x,y = meshgrid(x,y)
    X,Y = myFun([x,y])
    M = (hypot(X,Y))
    M[M==0]=1.
    X,Y = X/M, Y/M
    ax.quiver(x,y,ma.masked_outside(X,-3*pi+.1,3*pi-.1),Y,M,pivot='mid',color='r')
    ax.minorticks_on()
    ax.axis('scaled')
    ax.axis([-3*pi,3*pi, -3,3])
    ax.set_yticks(arange(-3,3.1,1.5))
    ax.set_xticks(arange(-3*pi,3.1*pi,pi))
    ax.set_xticklabels(
        [r'$-3\pi$',r'$-2\pi$',
        r'$-\pi$',r'$0$',r'$\pi$',
        r'$2\pi$',r'$3\pi$'])
    ax.set_xlabel(r'$\theta$')
    ax.set_ylabel(r'$\frac{\mathrm{d}\theta}{\mathrm{d}t}$')
    ax.grid(True)
    subplots_adjust(wspace=.1,hspace=-.1)
    fig.show()
    fig.savefig("pendulum.svg", bbox_inches="tight",\
        pad_inches=.15, transparent=False)
|
Data
| Matlab source code
|
function pendulumOde
% main function to numerically solve the pendulum ODE and plot the phase portrait
  figure;
  subplot(211);
  x = -pi:.1:3*pi;
  h = plot(x,-cos(x),'linewidth',2);
  set(gca,'yminortick','on','xtick',[-pi:pi/2:3*pi],'xticklabel',
    {'$-\\pi$';'$-\\frac{\\pi}{2}$';'$0$';'$\\frac{\\pi}{2}$';'$\\pi$';
    '$\\frac{3}{2}\\pi$';'$2\\pi$';'$\\frac{5}{2}\\pi$';'$3\\pi$'});
  xlim([-pi 3*pi])
  xlabel('$\theta$');
  ylabel('$V(\theta)$');
  grid on;
  subplot(212);
  [x,y] = meshgrid(-pi:.4:3*pi,-3:.2:3);
  u = zeros(size(x));
  v = zeros(size(y));
  for i = 1:numel(x)
    yy = ode_eq(0, [x(i),y(i)]);
    u(i) = yy(1);
    v(i) = yy(2);
    vmod = sqrt(u(i).^2 + v(i).^2);
    u(i) = u(i) / vmod;
    v(i) = v(i) / vmod;
  end
  quiver(x,y,u,v,'r');
  xlabel('$\theta$');
  ylabel('$\frac{\mathrm{d}\theta}{\mathrm{d}t}$');
  xlim([-pi 3*pi])
  ylim([-pi pi])
  grid on;
  set(gca,'yminortick','on','xtick',[-pi:pi/2:3*pi],'xticklabel',
    {'$-\\pi$';'$-\\frac{\\pi}{2}$';'$0$';'$\\frac{\\pi}{2}$';'$\\pi$';
    '$\\frac{3}{2}\\pi$';'$2\\pi$';'$\\frac{5}{2}\\pi$';'$3\\pi$'});
  hold all;

  dT = .01;
  T = 40;
  for c = 0:.5:5
    [x,y] = rungeKutta([c;0],dT,T,@ode_eq);
    plot(y(1,:),y(2,:),'b','linewidth',2);
    plot(y(1,:),-y(2,:),'b','linewidth',2);
    [x,y] = rungeKutta([0;c],dT,T,@ode_eq);
    plot(y(1,:),y(2,:),'b','linewidth',2);
    plot(-y(1,:),y(2,:),'b','linewidth',2);
    plot(y(1,:),-y(2,:),'b','linewidth',2);
    plot(-y(1,:),-y(2,:),'b','linewidth',2);
    [x,y] = rungeKutta([c;pi*2],dT,T,@ode_eq);
    plot(y(1,:),y(2,:),'b','linewidth',2);
    plot(y(1,:),-y(2,:),'b','linewidth',2);
    [x,y] = rungeKutta([pi*2;c],dT,T,@ode_eq);
    plot(y(1,:),y(2,:),'b','linewidth',2);
    plot(-y(1,:),y(2,:),'b','linewidth',2);
    plot(y(1,:),-y(2,:),'b','linewidth',2);
    plot(-y(1,:),-y(2,:),'b','linewidth',2);
  end
  print -depslatexstandalone "-S512,512" "pendulum.tex";
end

function dy = ode_eq(x,y)
% function that defines an n-dimensional ODE.
% In this case, the two linear ODEs of pendulum
  dy = [0;0];
  dy(1) = y(2);
  dy(2) = -sin(y(1));
end

function [x, y] = rungeKutta(y0, dT, T, dyFun, x0)
% A generalized Runge-Kutta algorithm to solve 'n' number of linear ODE
% obtained from an 'n'th degree ODE
  n = length(y0);
  if n > 1 && size(y0,2) == n
    y0 = y0';
  end
  if nargin < 5
    x0 = 0;
  end
  N = round(T/dT);
  x = zeros(1,N);
  y = zeros(n,N);
  x(1) = x0;
  y(:,1) = y0;
  for nn = 1:N-1
    k1 = feval(dyFun, x(nn), y(:,nn));
    k2 = feval(dyFun, x(nn)+.5*dT, y(:,nn)+.5*k1*dT);
    k3 = feval(dyFun, x(nn)+.5*dT, y(:,nn)+.5*k2*dT);
    k4 = feval(dyFun, x(nn)+dT, y(:,nn)+k3*dT);
    y(:,nn+1) = y(:,nn) + (dT/6) * (k1 + 2*k2 + 2*k3 + k4);
    x(nn+1) = x(nn) + dT;
  end
end
|
|


