
File:2017- Donald Trump - graph - false or misleading claims.png
原始檔案 (2,332 × 2,657 像素,檔案大小:597 KB,MIME 類型:image/png)

|
本圖片是以PNG、GIF或JPEG格式上傳。然而,其中包含的資料或訊息,應該重新建立成可縮放向量圖形(SVG)檔案,以更有效率或更準確的方式儲存。如有可能,請上傳本圖片的SVG格式版本。在上傳之後,請修改維基各姊妹計畫中所有使用舊版圖片的條目(列在圖像連結章節中),替換為新版圖片,並在舊圖片的描述頁中加入{{Vector version available|新圖片名稱.svg}}模板,同時移除本模板。
|
摘要
| 描述 |
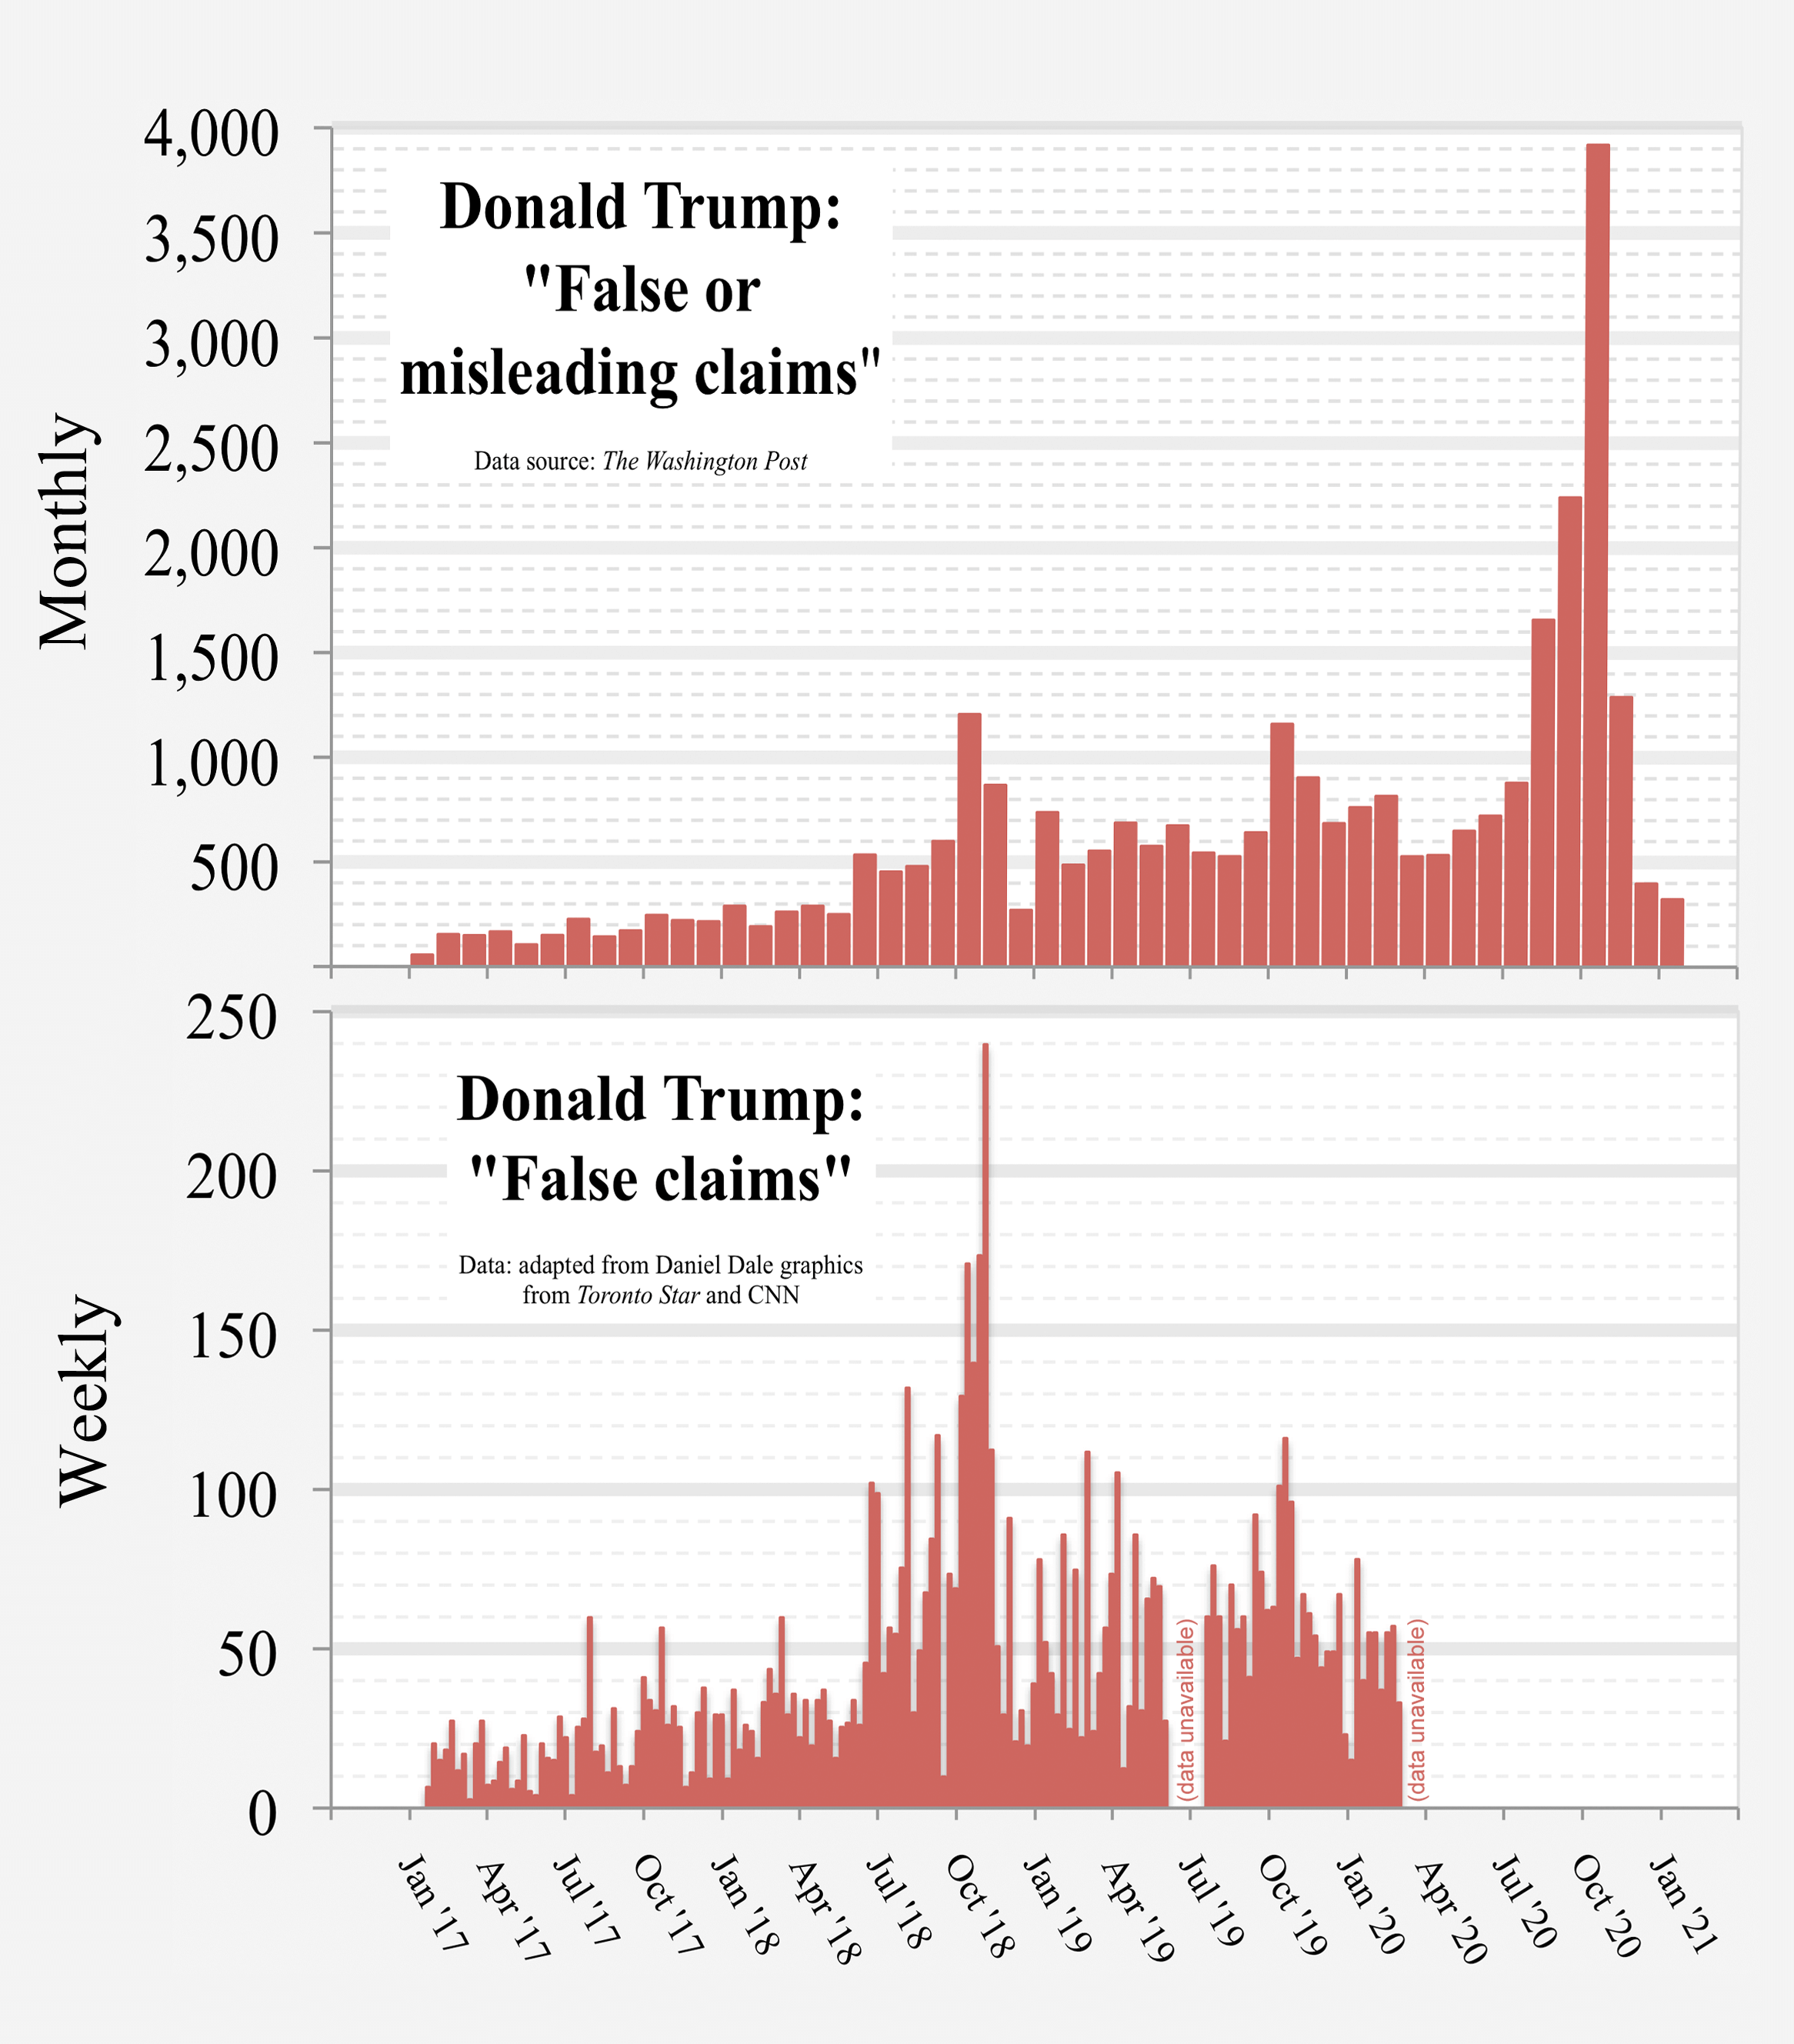
English: Charts showing findings of two newspapers' fact checkers re the number of "false or misleading" or "false" claims by U.S. President Donald Trump.
Data:
|
| 日期 | |
| 來源 | 自己的作品 |
| 作者 | RCraig09 |
| 其他版本 |
 Consolidated data into a single graph |
Data used to form the charts
Washington Post
| Click at right to show/hide The Washington Post data |
|---|
|
The Washington Post data:
|
Toronto Star and CNN data =
| Click at right to show/hide data adapted from Toronto Star and CNN graphics |
|---|
|
Data adapted by uploader from a Toronto Star graphic (is not the original data used to generate the newspaper's graphic): Week False claims (data unavailable for June and early July) 2019-07-19 60 (CNN source was dated March 9, 2020) Daniel Dale's (CNN) original source specified numbers daily; uploader added the values within each week to arrive at the foregoing weekly figures, with each week ending on a Friday to conform to Dale's earlier work at Toronto Star which also ended on Fridays.
|
授權條款
- 您可以自由:
- 分享 – 複製、發佈和傳播本作品
- 重新修改 – 創作演繹作品
- 惟需遵照下列條件:
- 姓名標示 – 您必須指名出正確的製作者,和提供授權條款的連結,以及表示是否有對內容上做出變更。您可以用任何合理的方式來行動,但不得以任何方式表明授權條款是對您許可或是由您所使用。
- 相同方式分享 – 如果您利用本素材進行再混合、轉換或創作,您必須基於如同原先的相同或兼容的條款,來分布您的貢獻成品。
檔案歷史
點選日期/時間以檢視該時間的檔案版本。
| 日期/時間 | 縮圖 | 尺寸 | 使用者 | 備註 | |
|---|---|---|---|---|---|
| 目前 | 2021年2月9日 (二) 05:34 | | 2,332 × 2,657(597 KB) | RCraig09 | Version 17: updating to include data for January 2021. Squaring off tops of columns and narrowing gaps between columns. Reduced filesize at tinypng.com |
| 2021年1月16日 (六) 07:31 |  | 2,332 × 2,657(560 KB) | RCraig09 | Version 16: Adding datapoints for Nov and Dec 2020. Reducing PNG filesize at tinypng.com (reduces number of bits per pixel). | |
| 2021年1月5日 (二) 23:20 |  | 2,332 × 2,657(1.64 MB) | RCraig09 | Version 15: Update to include Washington Post date through end of October 2020. | |
| 2020年12月20日 (日) 23:20 |  | 2,332 × 2,657(1.67 MB) | RCraig09 | Version 14: Updated to include Washington Post data through end of September 2020. | |
| 2020年11月16日 (一) 07:21 |  | 2,332 × 2,657(1.66 MB) | RCraig09 | Version 13: Updating graph to include exact value for August 2020 that no longer involves extrapolation for the last four days of the month. Washington Post added a few more days to their database. | |
| 2020年10月21日 (三) 23:06 |  | 2,332 × 2,657(1.66 MB) | RCraig09 | Version 12: Updating to include July and August data from Washington Post. Top panel's vertical had to be compressed to accommodate new high in data value (for August 2020). | |
| 2020年7月13日 (一) 06:01 |  | 2,332 × 2,657(1.43 MB) | RCraig09 | Update to include Washington Post data through end of June 2020. | |
| 2020年6月5日 (五) 05:09 |  | 2,332 × 2,657(1.49 MB) | RCraig09 | Version 10: Update to include Washington Post data for April and May 2020 | |
| 2020年4月15日 (三) 21:12 |  | 2,332 × 2,657(1.77 MB) | RCraig09 | Version 9: Updating with CNN Daniel Dale data for Jan and Feb 2020. | |
| 2020年4月15日 (三) 05:35 |  | 2,332 × 2,657(1.83 MB) | RCraig09 | Version 8: Adding "monthly" and "weekly" to vertical axes. |
檔案用途
下列頁面有用到此檔案:
全域檔案使用狀況
以下其他 wiki 使用了這個檔案:
- en-two.iwiki.icu 的使用狀況
- es.wikipedia.org 的使用狀況
- fa.wikipedia.org 的使用狀況
- ru.wikipedia.org 的使用狀況
- vi.wikipedia.org 的使用狀況