
File:E12 values graph.svg

此 SVG 檔案的 PNG 預覽的大小:575 × 420 像素。 其他解析度:320 × 234 像素 | 640 × 467 像素 | 1,024 × 748 像素 | 1,280 × 935 像素 | 2,560 × 1,870 像素。
原始檔案 (SVG 檔案,表面大小:575 × 420 像素,檔案大小:4 KB)
摘要
| 描述 |
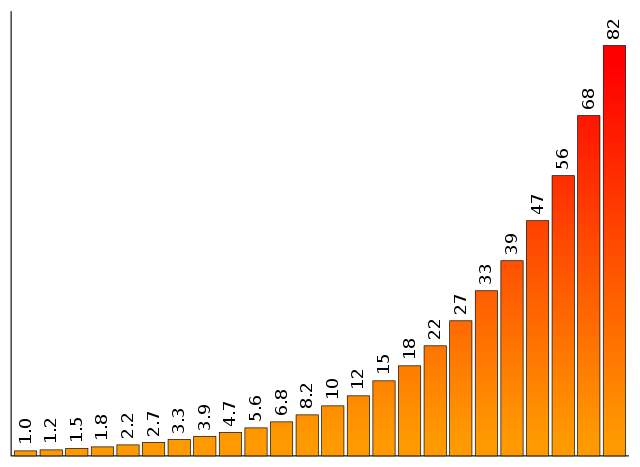
English: Graph showing values of the E12 series, which is used to standardize values of resistors and capacitors. The values shown cover two decades of the series, from 1 to 82, and illustrate the exponential nature of the series. |
| 日期 | |
| 來源 | Own work by uploader, designed to replace original bitmap image Image:E12_values_graph.png |
| 作者 | Qef |
| 其他版本 | Bitmap version showing the same data, but with superfluous labels, making it not language neutral: Image:E12_values_graph.png |
授權條款
| 此作品已由其作者,Qef,釋出至公有領域。此授權條款在全世界均適用。 這可能在某些國家不合法,如果是的話: |
Source code
This graph was generated by the Perl program below, which was specially written for the purpose. If changes need to be made, it's probably best to tweak the program and re-run it to get a new version, rather than editing the SVG directly.
use warnings;
use strict;

# The E12 series twice over, the first time divided by 10.
my @VALUES = qw(
    1.0 1.2 1.5 1.8 2.2 2.7 3.3 3.9 4.7 5.6 6.8 8.2
    10  12  15  18  22  27  33  39  47  56  68  82
);

# Parameters to set appearance.
my $AXIS_HT = 400;
my $VERT_SCALE = 4.5;
my $BAR_WIDTH = 20;
my $BAR_GAP = 3;
my $MARGIN = 10;

my $img_wd = ($BAR_WIDTH + $BAR_GAP) * @VALUES + $BAR_GAP + 2 * $MARGIN;
my $img_ht = $AXIS_HT + 2 * $MARGIN;
my $margin_right = $img_wd - $MARGIN;
my $margin_bottom = $img_ht - $MARGIN;

my $x = $MARGIN;
my $graph_path = '';
my $text_cmds = '';
for (@VALUES) {
    $x += $BAR_GAP;
    my $bar_ht = $_ * $VERT_SCALE;
    $graph_path .= "M$x,$margin_bottom v-$bar_ht h$BAR_WIDTH v$bar_ht Z\n";
    $x += $BAR_WIDTH;
    my $bar_top = $img_ht - $bar_ht - $MARGIN + -5;
    my $txt_x = $x - 0.5 * $BAR_WIDTH + 4.5;
    $text_cmds .= "  <text transform='translate($txt_x,$bar_top) rotate(270)'" .
                  " x='0' y='0' fill='#000' text-anchor='start'>$_</text>\n";
}

print <<"END";
<?xml version="1.0" encoding="UTF-8"?>
<svg version="1.0" width="$img_wd" height="$img_ht"
     xmlns="http://www.w3.org/2000/svg">

 <defs>
  <linearGradient id="grad" x2="0%" y1="0%" y2="100%">
   <stop offset="5%" stop-color="#F00" />
   <stop offset="95%" stop-color="#F90" />
  </linearGradient>
 </defs>

 <path stroke="#000" stroke-width="1" fill="none"
       d="M$MARGIN,$MARGIN V$margin_bottom H$margin_right"/>
 <path stroke="#000" stroke-width="0.6" fill="url(#grad)" d="$graph_path"/>
 <path stroke="#333" stroke-width="0.6" fill="url(#grad)" d="$graph_path">
 </g>
</svg>
END
檔案歷史
點選日期/時間以檢視該時間的檔案版本。
| 日期/時間 | 縮圖 | 尺寸 | 用戶 | 備註 | |
|---|---|---|---|---|---|
| 目前 | 2008年7月3日 (四) 17:07 | | 575 × 420(4 KB) | Qef | {{Information |Description={{en|1=Graph showing values of the E12 series, which is used to standardize values of resistors and capacitors. The values shown cover two decades of the series, from 1 to 82, and illustrates the exponential nature of the serie |
檔案用途
下列頁面有用到此檔案:
全域檔案使用狀況
以下其他 wiki 使用了這個檔案:
- bg.wikipedia.org 的使用狀況
- da.wikipedia.org 的使用狀況
- de.wikipedia.org 的使用狀況
- en-two.iwiki.icu 的使用狀況
- User:Augur
- User:VinceyB
- User:Simen 88
- User:NekrosKoma
- User:Masterhomer
- Wikipedia:Userboxes/Philosophy
- User:MaesterTonberry
- User:Java7837/userboxing/Singularitarian
- User:Saukkomies/My userboxes
- User:Vaerinn
- User:Keskival
- User:Test35965
- User:Elsa-and-Anya
- User:ImmortalRationalist
- User:KiefKief
- User:AnnonJung
- User:Thablaqkgoat
- User:FrederickII
- E series of preferred numbers
- User:AllanVolt
- User:Just an ordinary human
- User:HeyTomek
- User:Berkay123456789
- en.wikiversity.org 的使用狀況
- eo.wikipedia.org 的使用狀況
- et.wikipedia.org 的使用狀況
- he.wikipedia.org 的使用狀況
- uk.wikipedia.org 的使用狀況