
File:1990- Electricity consumption - shares by region - IEA data.svg

此 SVG 檔案的 PNG 預覽的大小:800 × 600 像素。 其他解析度:320 × 240 像素 | 640 × 480 像素 | 1,024 × 768 像素 | 1,280 × 960 像素 | 2,560 × 1,920 像素 | 1,000 × 750 像素。
原始檔案 (SVG 檔案,表面大小:1,000 × 750 像素,檔案大小:2 KB)
摘要
| 描述 |
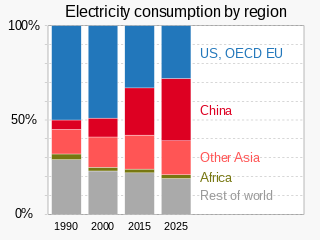
English: Stacked column chart (bar chart) showing electricity consumption by region for 1990, 2000, 2015 and 2025 based on data from International Energy Agency (IEA)
|
||
| 日期 | |||
| 來源 | 自己的作品 | ||
| 作者 | RCraig09 |

授權條款
我,本作品的著作權持有者,決定用以下授權條款發佈本作品:
此檔案採用創用CC 姓名標示-相同方式分享 4.0 國際授權條款。
- 您可以自由:
- 分享 – 複製、發佈和傳播本作品
- 重新修改 – 創作演繹作品
- 惟需遵照下列條件:
- 姓名標示 – 您必須指名出正確的製作者,和提供授權條款的連結,以及表示是否有對內容上做出變更。您可以用任何合理的方式來行動,但不得以任何方式表明授權條款是對您許可或是由您所使用。
- 相同方式分享 – 如果您利用本素材進行再混合、轉換或創作,您必須基於如同原先的相同或兼容的條款,來分布您的貢獻成品。
檔案歷史
點選日期/時間以檢視該時間的檔案版本。
| 日期/時間 | 縮圖 | 尺寸 | 使用者 | 備註 | |
|---|---|---|---|---|---|
| 目前 | 2023年3月22日 (三) 04:38 | | 1,000 × 750(2 KB) | RCraig09 | Uploaded own work with UploadWizard |
檔案用途
下列2個頁面有用到此檔案:
全域檔案使用狀況
以下其他 wiki 使用了這個檔案:
- en-two.iwiki.icu 的使用狀況
- sq.wikipedia.org 的使用狀況